Definitions: <option> An option reported by the -options option <vmid> Virtual Machine Identifier. A vmid takes the following form: <lvmid>[@<hostname>[:<port>]] Where <lvmid> is the local vm identifier for the target Java virtual machine, typically a process id; <hostname> is the name of the host running the target Java virtual machine; and <port> is the port number for the rmiregistry on the target host. See the jvmstat documentation for a more complete description of the Virtual Machine Identifier. <lines> Number of samples between header lines. <interval> Sampling interval. The following forms are allowed: <n>["ms"|"s"] Where <n> is an integer and the suffix specifies the units as milliseconds("ms") or seconds("s"). The default units are "ms". <count> Number of samples to take before terminating. -J<flag> Pass <flag> directly to the runtime system. -? -h --help Prints this help message. -help Prints this help message.
C:\Users\Administrator>jinfo Usage: jinfo <option> <pid> (to connect to a running process)
where <option> is one of: -flag <name> to print the value of the named VM flag -flag [+|-]<name> to enable or disable the named VM flag -flag <name>=<value> to set the named VM flag to the given value -flags to print VM flags -sysprops to print Java system properties <no option> to print both VM flags and system properties -? | -h | --help | -help to print this help message
C:\Users\Administrator>jmap -help Usage: jmap -clstats <pid> to connect to running process and print class loader statistics jmap -finalizerinfo <pid> to connect to running process and print information on objects awaiting finalization jmap -histo[:live] <pid> to connect to running process and print histogram of java object heap if the "live" suboption is specified, only count live objects jmap -dump:<dump-options> <pid> to connect to running process and dump java heap jmap -? -h --help to print this help message
dump-options: live dump only live objects; if not specified, all objects in the heap are dumped. format=b binary format file=<file> dump heap to <file>
C:\Users\Administrator>jhsdb jmap --help <no option> To print same info as Solaris pmap. --heap To print java heap summary. --binaryheap To dump java heap in hprof binary format. --dumpfile <name> The name of the dump file. --histo To print histogram of java object heap. --clstats To print class loader statistics. --finalizerinfo To print information on objects awaiting finalization. --pid <pid> To attach to and operate on the given live process. --core <corefile> To operate on the given core file. --exe <executable for corefile> --connect [<id>@]<host> To connect to a remote debug server (debugd).
The --core and --exe options must be set together to give the core file, and associated executable, to operate on. They can use absolute or relative paths. The --pid option can be set to operate on a live process. The --connect option can be set to connect to a debug server (debugd). --core, --pid, and --connect are mutually exclusive.
Examples: jhsdb jmap --pid 1234 or jhsdb jmap --core ./core.1234 --exe ./myexe or jhsdb jmap --connect debugserver or jhsdb jmap --connect id@debugserver
如上命令需要改为
1
jhsdb jmap --heap --pid 37464
[!CAUTION]
请确保此工具的 JDK 版本和程序的 JDK 版本一致,否则会出现下面的错误
1 2 3 4 5 6 7 8 9 10 11 12 13 14 15 16 17
C:\Users\Administrator>jhsdb jmap --heap --pid 37464 Attaching to process ID 37464, please wait... Exception in thread "main" java.lang.RuntimeException: Type "GenericGrowableArray", referenced in VMStructs::localHotSpotVMStructs in the remote VM, was not present in the remote VMStructs::localHotSpotVMTypes table (should have been caught in the debug build of that VM). Can not continue. at jdk.hotspot.agent/sun.jvm.hotspot.HotSpotTypeDataBase.lookupOrFail(HotSpotTypeDataBase.java:596) at jdk.hotspot.agent/sun.jvm.hotspot.HotSpotTypeDataBase.lookupType(HotSpotTypeDataBase.java:120) at jdk.hotspot.agent/sun.jvm.hotspot.HotSpotTypeDataBase.lookupOrCreateClass(HotSpotTypeDataBase.java:631) at jdk.hotspot.agent/sun.jvm.hotspot.HotSpotTypeDataBase.createType(HotSpotTypeDataBase.java:751) at jdk.hotspot.agent/sun.jvm.hotspot.HotSpotTypeDataBase.readVMTypes(HotSpotTypeDataBase.java:195) at jdk.hotspot.agent/sun.jvm.hotspot.HotSpotTypeDataBase.<init>(HotSpotTypeDataBase.java:89) at jdk.hotspot.agent/sun.jvm.hotspot.HotSpotAgent.setupVM(HotSpotAgent.java:393) at jdk.hotspot.agent/sun.jvm.hotspot.HotSpotAgent.go(HotSpotAgent.java:307) at jdk.hotspot.agent/sun.jvm.hotspot.HotSpotAgent.attach(HotSpotAgent.java:142) at jdk.hotspot.agent/sun.jvm.hotspot.tools.Tool.start(Tool.java:185) at jdk.hotspot.agent/sun.jvm.hotspot.tools.Tool.execute(Tool.java:118) at jdk.hotspot.agent/sun.jvm.hotspot.tools.JMap.main(JMap.java:176) at jdk.hotspot.agent/sun.jvm.hotspot.SALauncher.runJMAP(SALauncher.java:369) at jdk.hotspot.agent/sun.jvm.hotspot.SALauncher.main(SALauncher.java:538)
D:\Java\jdk-17.0.8\bin>jhsdb jmap --heap --pid 37464 Attaching to process ID 37464, please wait... Debugger attached successfully. Server compiler detected. JVM version is 17.0.8+9-LTS-211
using thread-local object allocation. Garbage-First (G1) GC with 23 thread(s)
Heap Usage: G1 Heap: regions = 2043 capacity = 17137926144 (16344.0MB) used = 13493056 (12.86798095703125MB) free = 17124433088 (16331.132019042969MB) 0.07873213997204631% used G1 Young Generation: Eden Space: regions = 0 capacity = 33554432 (32.0MB) used = 0 (0.0MB) free = 33554432 (32.0MB) 0.0% used Survivor Space: regions = 0 capacity = 0 (0.0MB) used = 0 (0.0MB) free = 0 (0.0MB) 0.0% used G1 Old Generation: regions = 2 capacity = 33554432 (32.0MB) used = 13493056 (12.86798095703125MB) free = 20061376 (19.13201904296875MB) 40.212440490722656% used
jmap -histo <pid>
输出堆中对象的同级信息,包括类、实例数量和合计容量,也是这一时刻的内存中的对象信息
1
jmap -histo 3540 > b.txt
与 -heap 一样,如果是 JDK 8 以上版本,则需要使用 jhsdb jmap 代替。
1 2 3 4 5 6 7 8 9 10 11 12 13 14 15 16 17
D:\Java\jdk-17.0.8\bin>jhsdb jmap --histo --pid 37464 Attaching to process ID 37464, please wait... Debugger attached successfully. Server compiler detected. JVM version is 17.0.8+9-LTS-211 Iterating over heap. This may take a while... Object Histogram:
-J<flag> Pass <flag> directly to the runtime system. For example, -J-mx512m to use a maximum heap size of 512MB -stack false: Turn off tracking object allocation call stack. -refs false: Turn off tracking of references to objects -port <port>: Set the port for the HTTP server. Defaults to 7000 -exclude <file>: Specify a file that lists data members that should be excluded from the reachableFrom query. -baseline <file>: Specify a baseline object dump. Objects in both heap dumps with the same ID and same class will be marked as not being "new". -debug <int>: Set debug level. 0: No debug output 1: Debug hprof file parsing 2: Debug hprof file parsing, no server -version Report version number -h|-help Print this help and exit <file> The file to read
For a dump file that contains multiple heap dumps, you may specify which dump in the file by appending "#<number>" to the file name, i.e. "foo.hprof#3".
Options: -l long listing. Prints additional information about locks -e extended listing. Prints additional information about threads -? -h --help -help to print this help message
command must be a valid jcmd command for the selected jvm. Use the command "help" to see which commands are available. If the pid is 0, commands will be sent to all Java processes. The main class argument will be used to match (either partially or fully) the class used to start Java. If no options are given, lists Java processes (same as -l).
PerfCounter.print display the counters exposed by this process -f read and execute commands from the file -l list JVM processes on the local machine -? -h --help print this help message
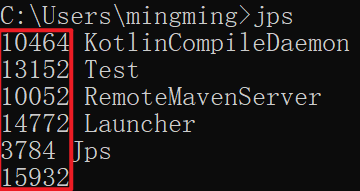
jcmd -l 列出所有的JVM进程
1 2 3 4
C:\Users\Administrator>jcmd -l
37492 org.jetbrains.jps.cmdline.Launcher D:/Program Files/JetBrains/IntelliJ IDEA 2023.1.3/plugins/java/lib/jps-builders.jar;D:/Program Files/JetBrains/IntelliJ IDEA 2023.1.3/plugins/java/lib/jps-builders-6.jar;D:/Program Files/JetBrains/IntelliJ IDEA 2023.1.3/plugins/java/lib/jps-javac-extension.jar;D:/Program Files/JetBrains/IntelliJ IDEA 2023.1.3/lib/util-8.jar;D:/Program Files/JetBrains/IntelliJ IDEA 2023.1.3/lib/util_rt.jar;D:/Program Files/JetBrains/IntelliJ IDEA 2023.1.3/lib/platform-loader.jar;D:/Program Files/JetBrains/IntelliJ IDEA 2023.1.3/lib/annotations.jar;D:/Program Files/JetBrains/IntelliJ IDEA 2023.1.3/lib/trove.jar;D:/Program Files/JetBrains/IntelliJ IDEA 2023.1.3/plugins/java/lib/jetbrains.kotlinx.metadata.jvm.jar;D:/Program Files/JetBrains/IntelliJ IDEA 2023.1.3/lib/protobuf.jar;D:/Program Files/JetBrains/IntelliJ IDEA 2023.1.3/lib/jps-model.jar;D:/Program Files/JetBrains/IntelliJ IDEA 2023.1.3/plugins/java/lib/javac2.jar;D:/Program Files/JetBrains/IntelliJ IDEA 2023.1.3/lib/forms_rt.jar;D:/Prog
37464 org.depsea.springwebmvcdemo.SpringWebmvcDemoApplication
49420 jdk.jcmd/sun.tools.jcmd.JCmd -l